2020 IMAGE RESEARCH DATA GATHERING & TESTING
research conclusionS
What did I find out?
1) the “best practice” tools for collecting user data?
THE TOOLS NEED TO BE SPECIFIC FOR THE PROJECT
EVALUATION PROCESS
DEVELOP TOOLS TO FIT THE DESIRED GOAL
OPEN SOURCE RESOURCES
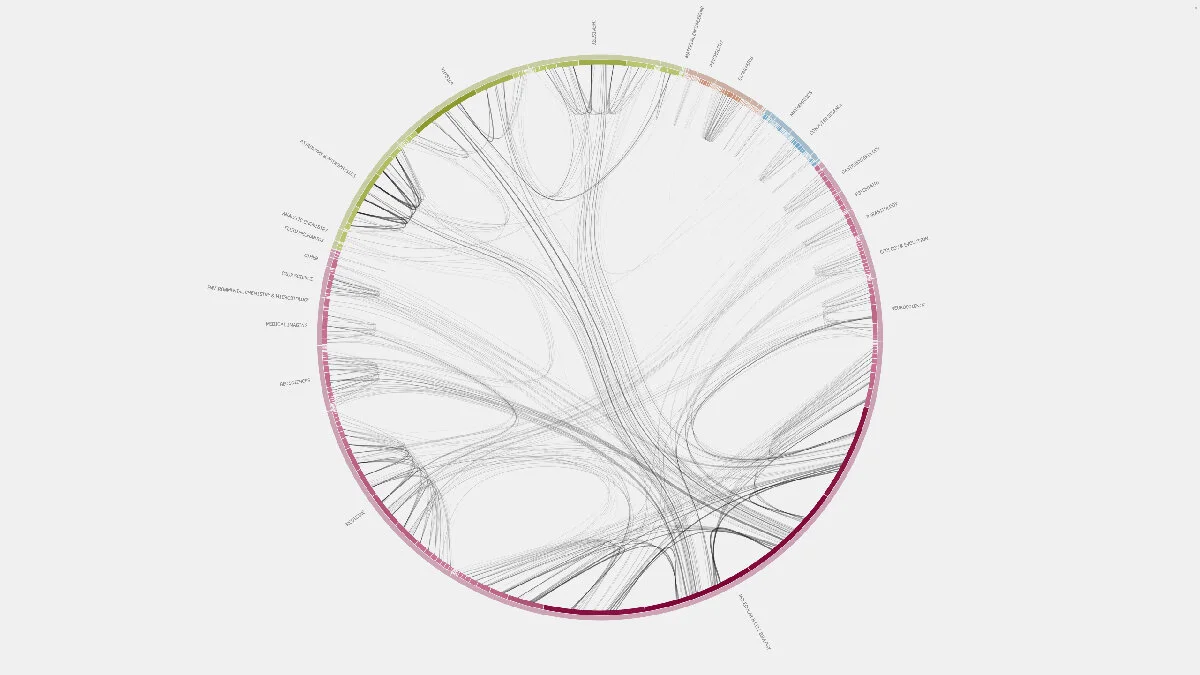
“Phototrails” © Lev Manovich, Instagram Cities - A detail from Plot visualization of 33,292 photos from Tel-Aviv, sorted by time and hue. Co-authors: Nadav Hochman and Jay Chow. http://phototrails.info/instagram-cities/
“Phototrails” © Lev Manovich, Instagram Cities - A detail from Plot visualization by time of day per 289 users. http://phototrails.info/instagram-cities/
2) What methods are practiced today for image user testing?
ANALYTIC STATISTICS
TYPE OF ANALYSIS: TEMPORAL, GEOGRAPHIC, CONTENT BASED, NETWORK BASED
DEFINITION OF SCALE (MICRO, MESO, MACRO)
HEATMAPS / EYE TRACKING
3) HOW CAN information BE applied and used in Empirical research?
VISUALIZATION OF DATA
CHOOSE GOOD TOOLS & DEVELOP BETTER TOOLS
OBSERVER AND ANALYZE
VALUE OF COMPARISON
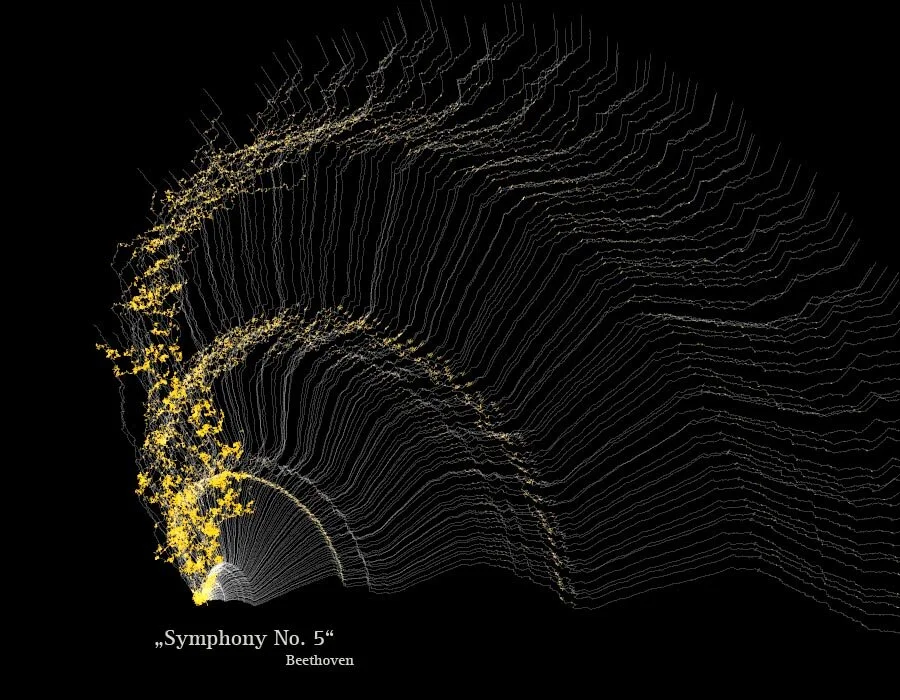
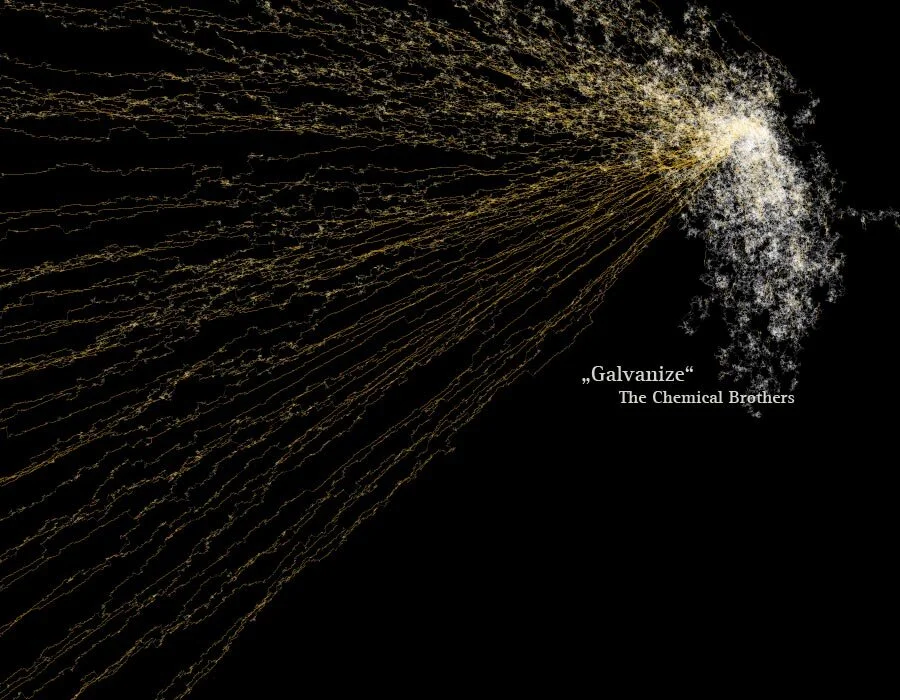
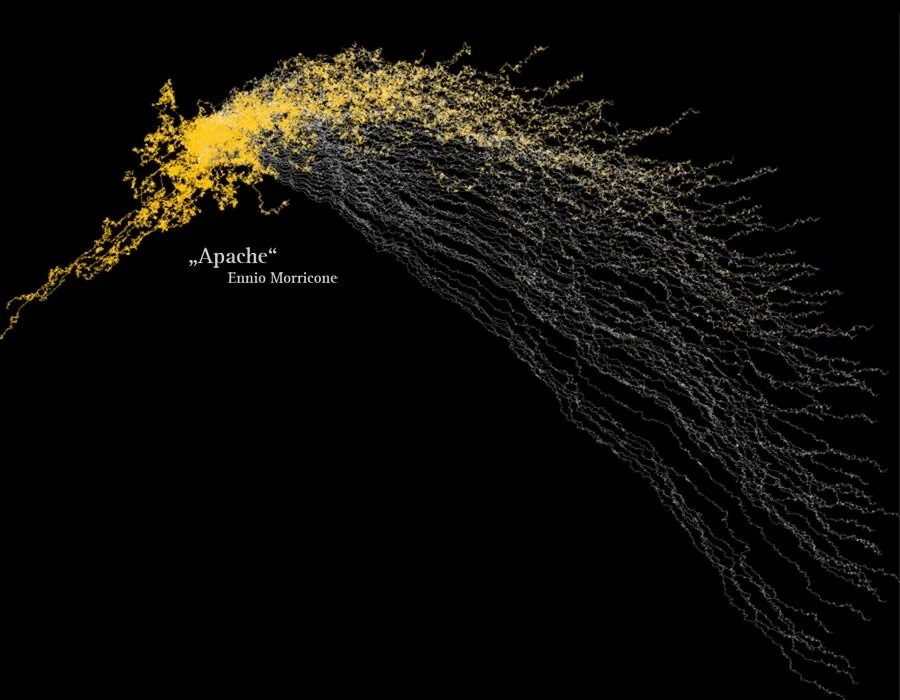
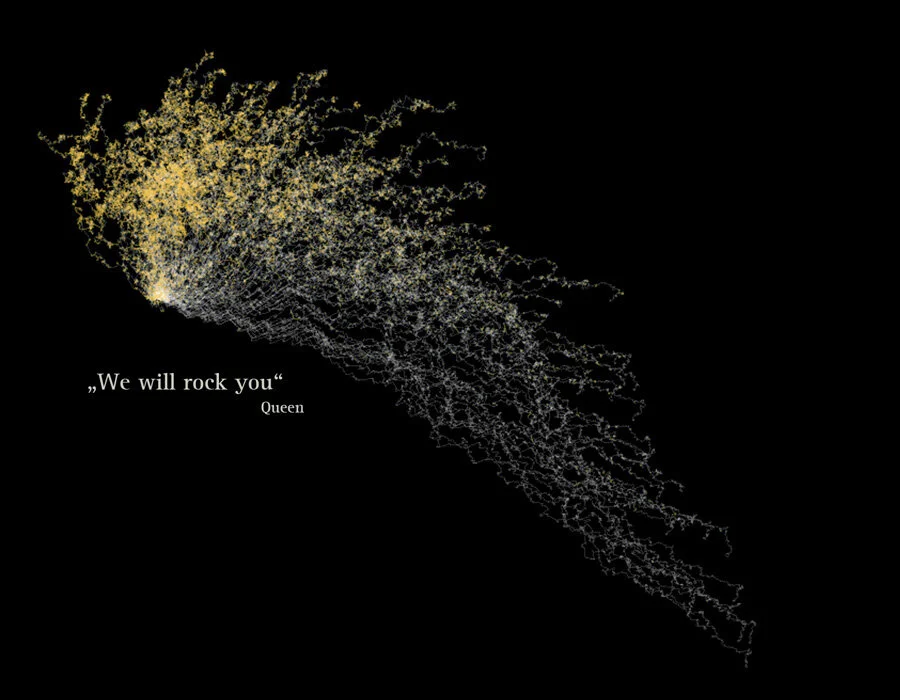
© Matthias Dittrich, Narratives 2.0, music segmented in single channels. Built using Java and Processing Sketch.
further information in my WRITTEN PAPER:

LEARNING BY DOING