
2020 IMAGE RESEARCH DATA GATHERING & TESTING
METHODOLOGY
tools for data visualization
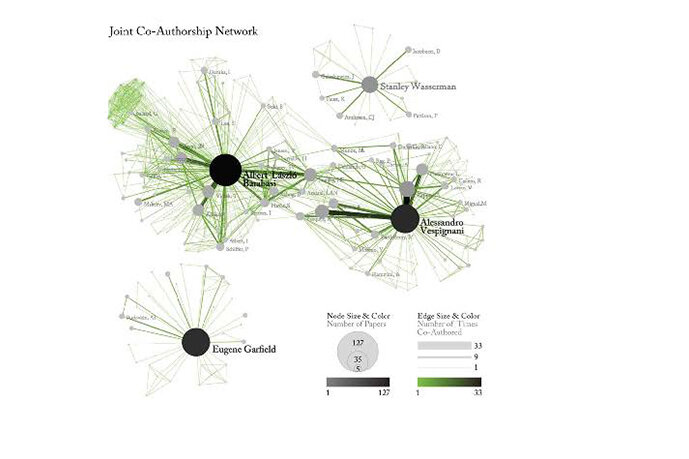
«To observe and analyse culture means to be able to map and measure three fundamental characteristics. These characteristics are diversity, structures (e.g., clusters networks, and other types of relations), and dynamics (temporal changes).» - Lev Manovich
“Can We Think Without Categories?”
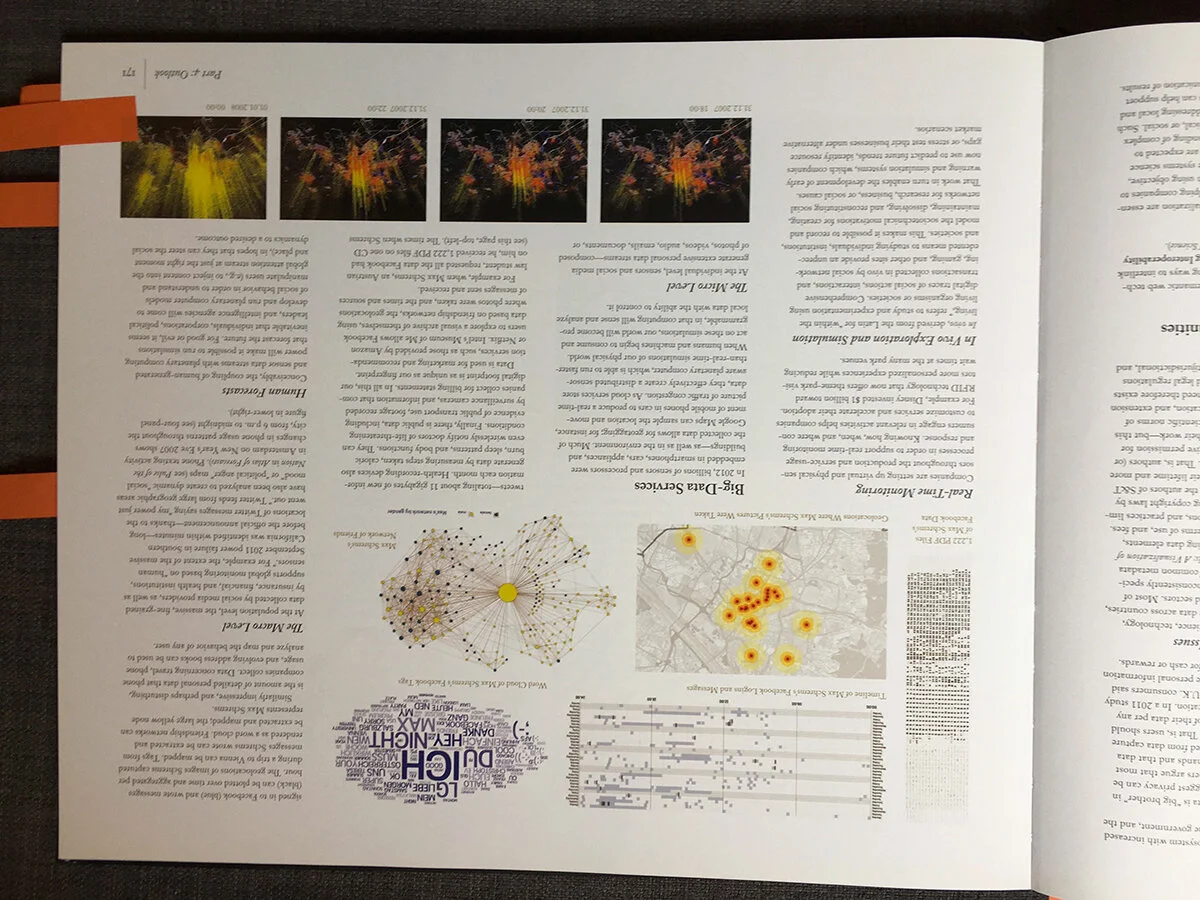
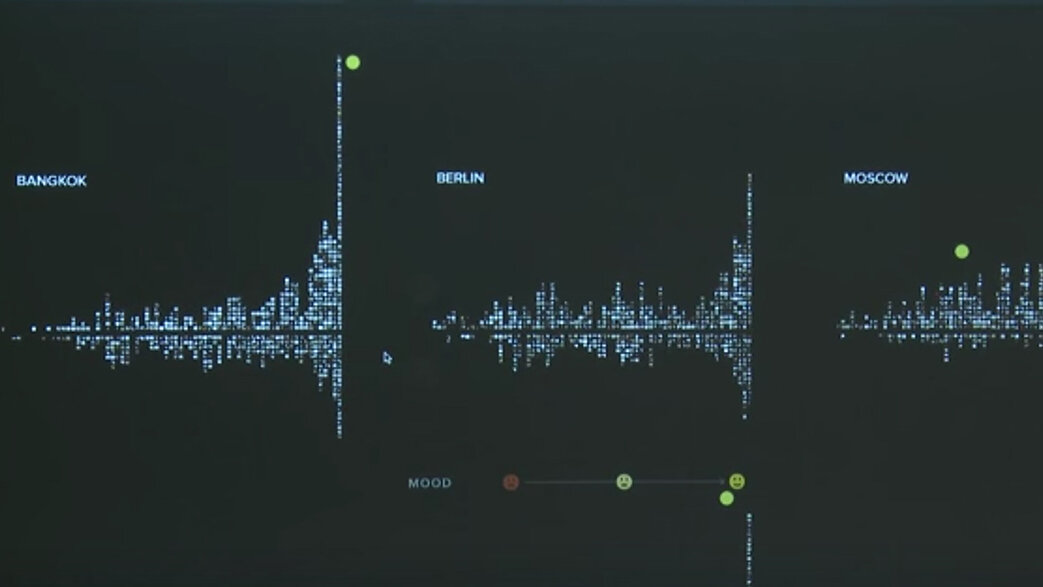
“Phototrails” © Lev Manovich, Instagram Cities - 50,000 Instagram photos from Bangkok, organized by brightness mean (radius) and hue median (perimeter). Co-authors: Nadav Hochman and Jay Chow. http://phototrails.info/instagram-cities/
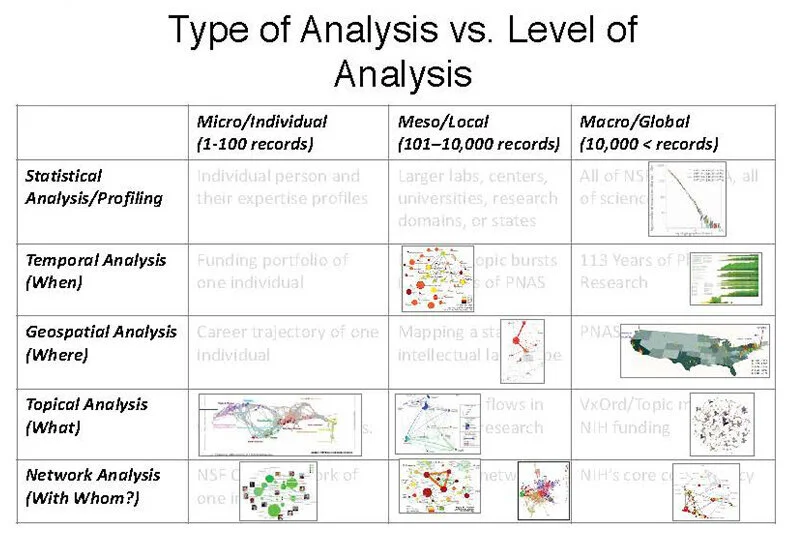
First step: define the type and level of analysis
“Visual insights: a practical guide to making sense of data” - Katy Börner
Professor of Information Science in the Department of Information and Library Science, School of Informatics and Computing
Adjunct Professor at the Department of Statistics in the College of Arts and Sciences / Core Faculty of Cognitive Science
Research Affiliate of the Center for Complex Networks and Systems Research and Bio-complexity Institute,
Member of the Advanced Visualization Laboratory / Leader of the Information Visualization Lab
Founding Director of the Cyberinfrastructure for Network Science Center at Indiana University in Bloomington,
IN and Visiting Professor at the Royal Netherlands Academy of Arts and Sciences (KNAW) in The Netherlands.
She is a curator of the international Places & Spaces: Mapping Science exhibit
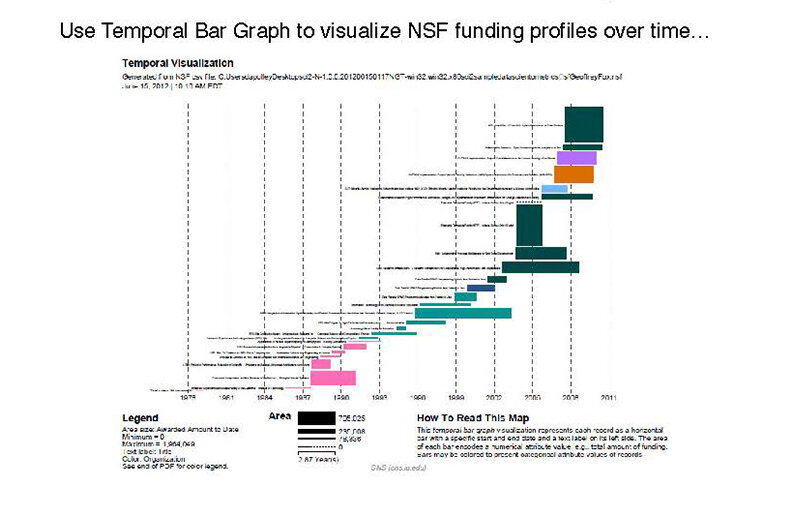
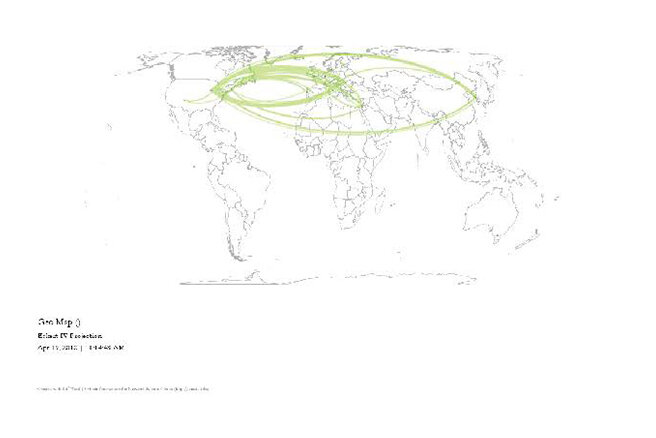
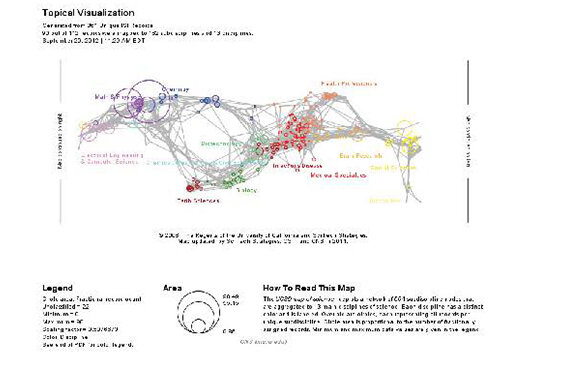
types - temporal - geographic - topical - network
make it visible to the eye
“Atlas of Knowledge: Anyone Can Map” - Katy Börner

The value of seeing data is clear,
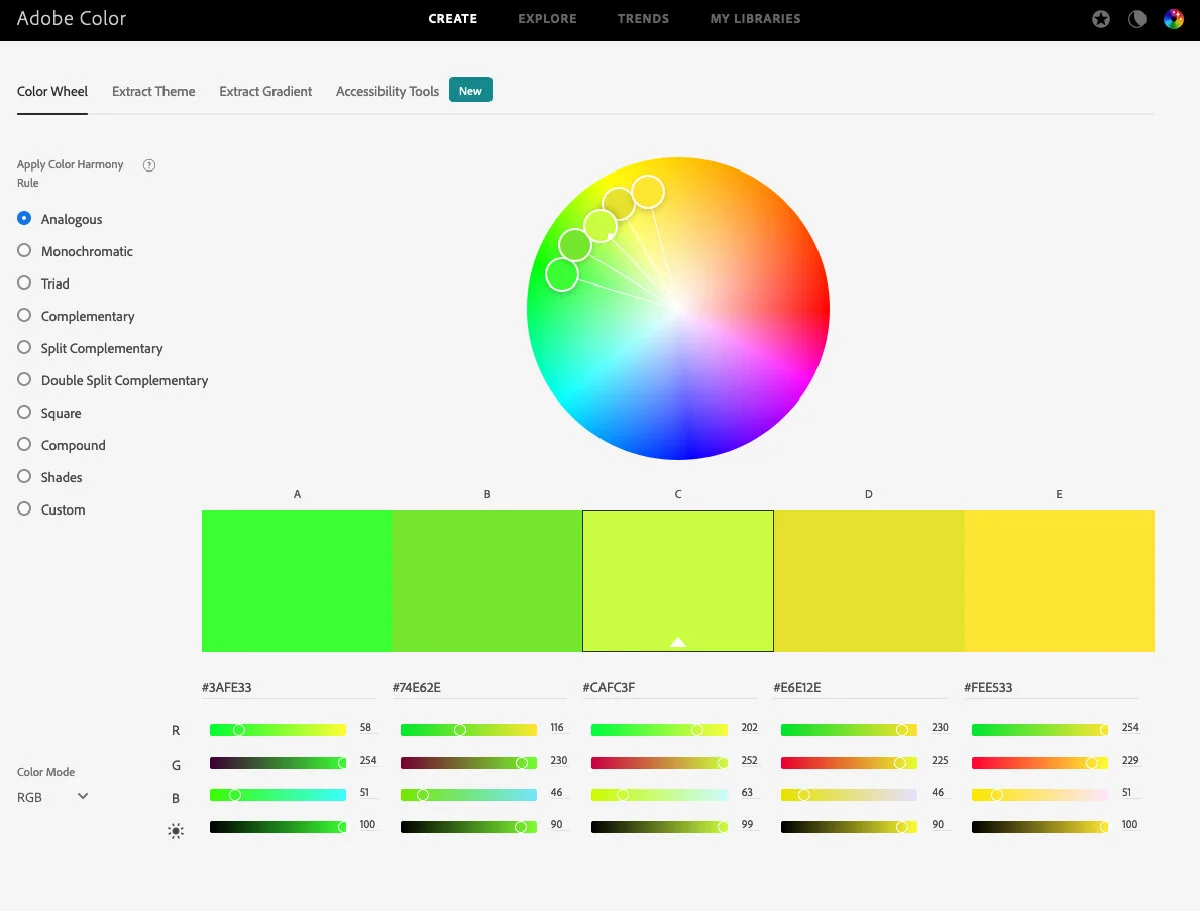
but Which tools to use?
DATA VISUALIZATION TOOLBOX:
Github
40 million users - 100 million repositories - 32 million monthly visits
“55’363 repositories - with the search: data visualiZation”
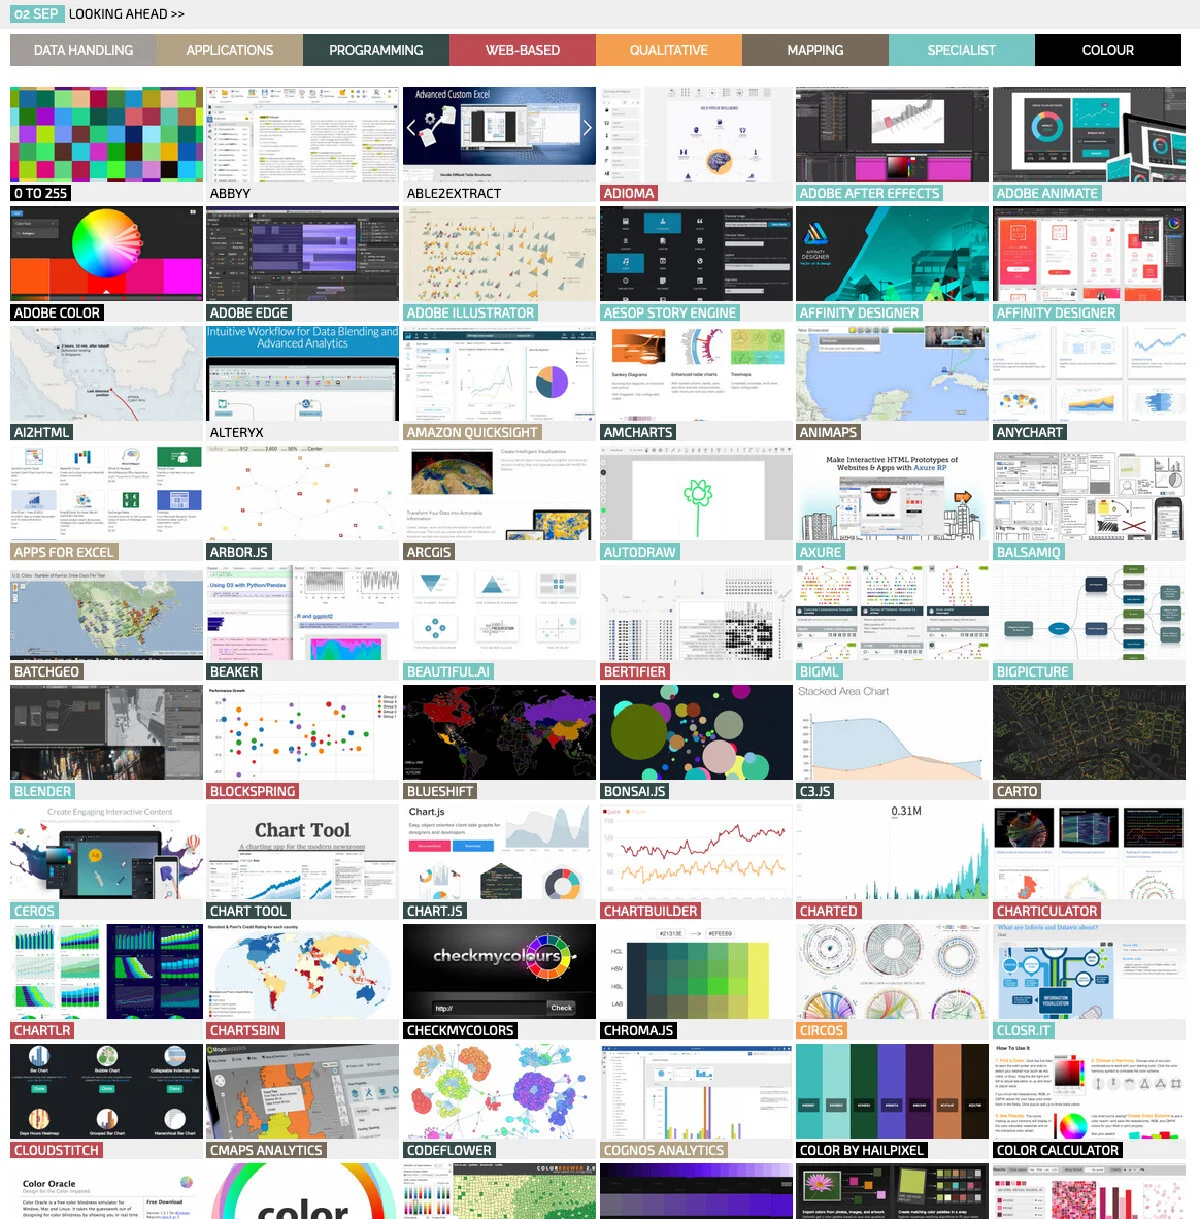
Visualising Data

Andy Kirk - 2020 tools
Data Visualisation: A Handbook for Data Driven Design
Is a freelance data visualisation specialist based in Yorkshire, UK. He discovered data visualisation in early 2007, and it became his Master’s (MA) degree research proposal, giving him the opportunity to unlock and secure his passion for the subject.
He launched visualisingdata.com to continue the process of discovery and to chart the course of the increasing popularity of the subject. Over time, this award-winning site has grown to become a popular reference for followers of the field, offering contemporary discourse, design techniques, and vast collections of visualisation examples and resources.


RESEARCH CONCLUSIONS